If You Can Make It There: The Price of Living in the City That Never Sleeps
MICA — Data Analytics and Visualization MPS
This solo project presents an investigation into the housing affordability crisis facing New York City renters, built in Tableau and drawing from the New York City Housing and Vacancy Survey. Designed for a policy and urban planning audience, each dashboard in the data story presents a central idea and offers several charts to support it.
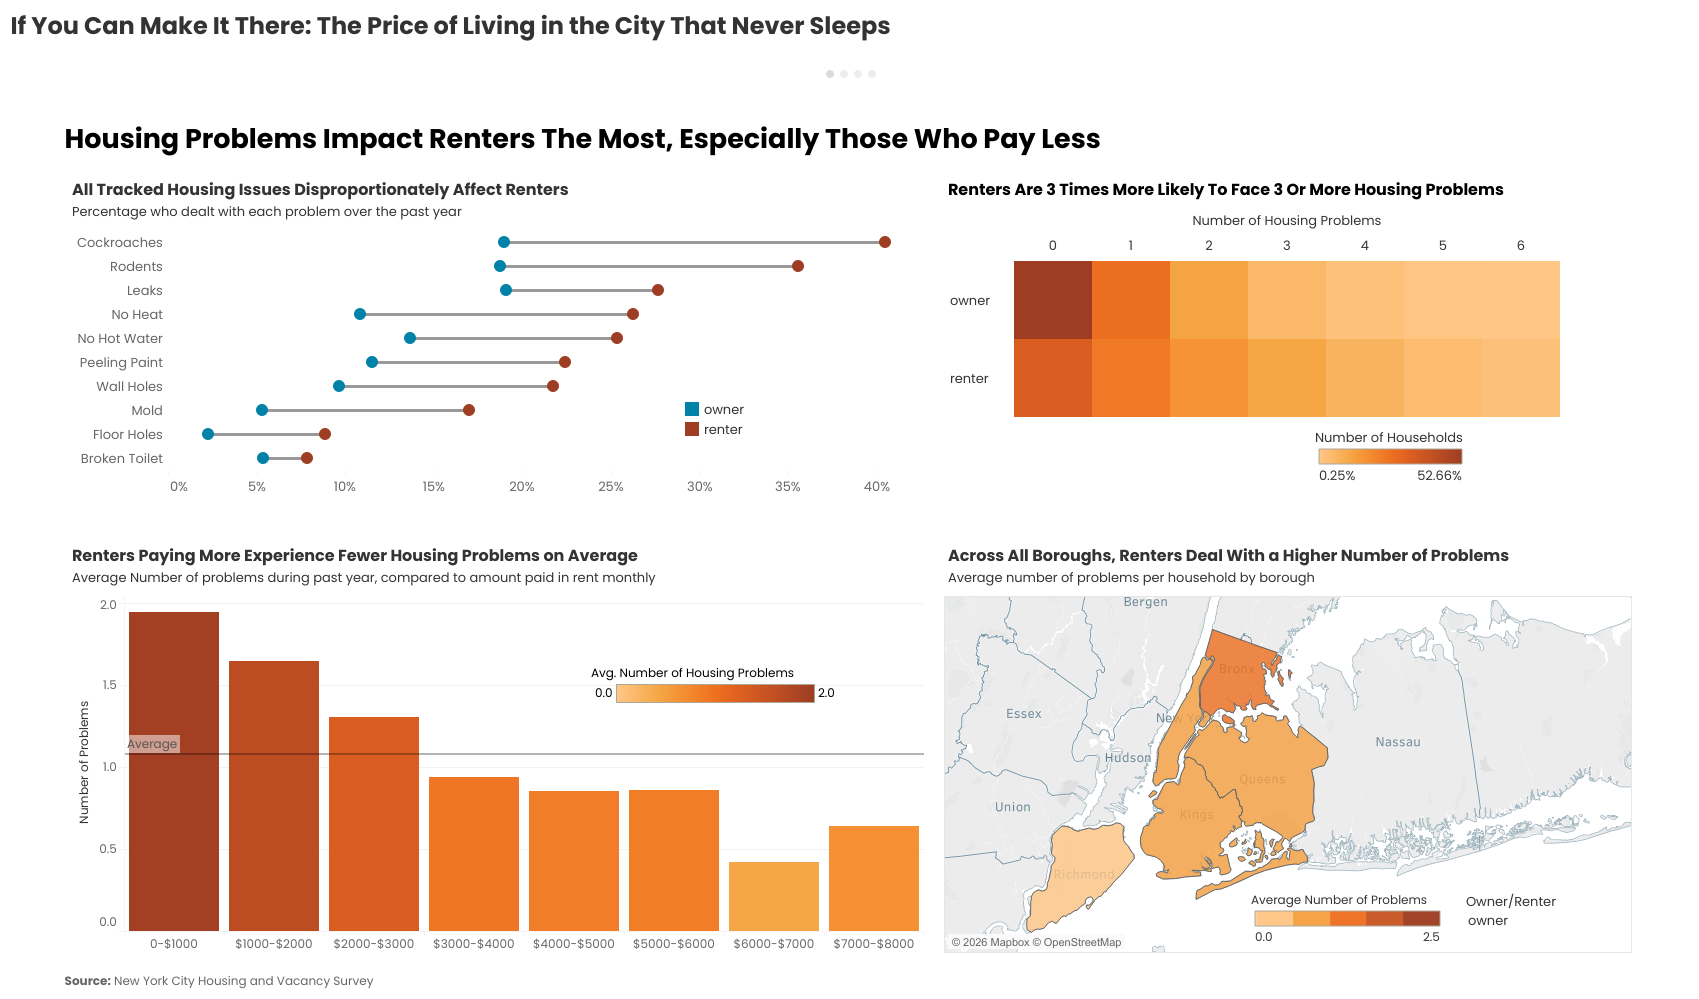
The first dashboard highlights, through a dumbbell chart, heat map, bar chart, and a map, that renters deal with more problems than owners and that renters who pay the least deal with the most problems.
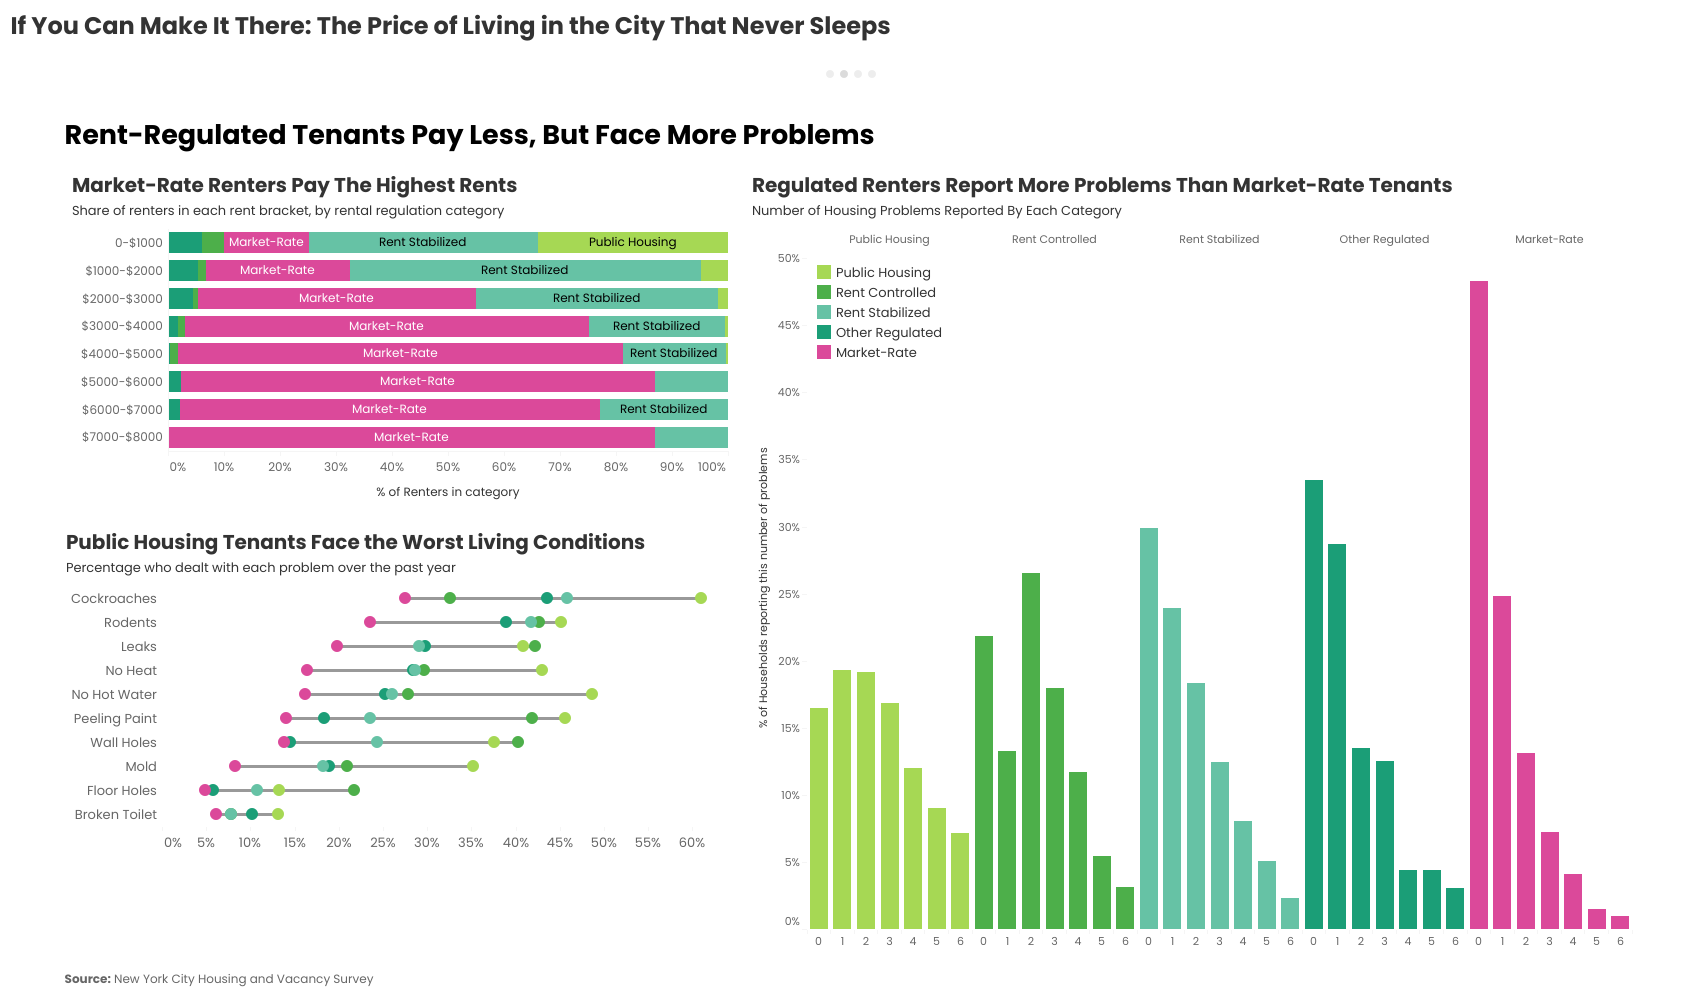
The second dashboard highlights the difference in conditions between market-rate tenants and those in public housing.
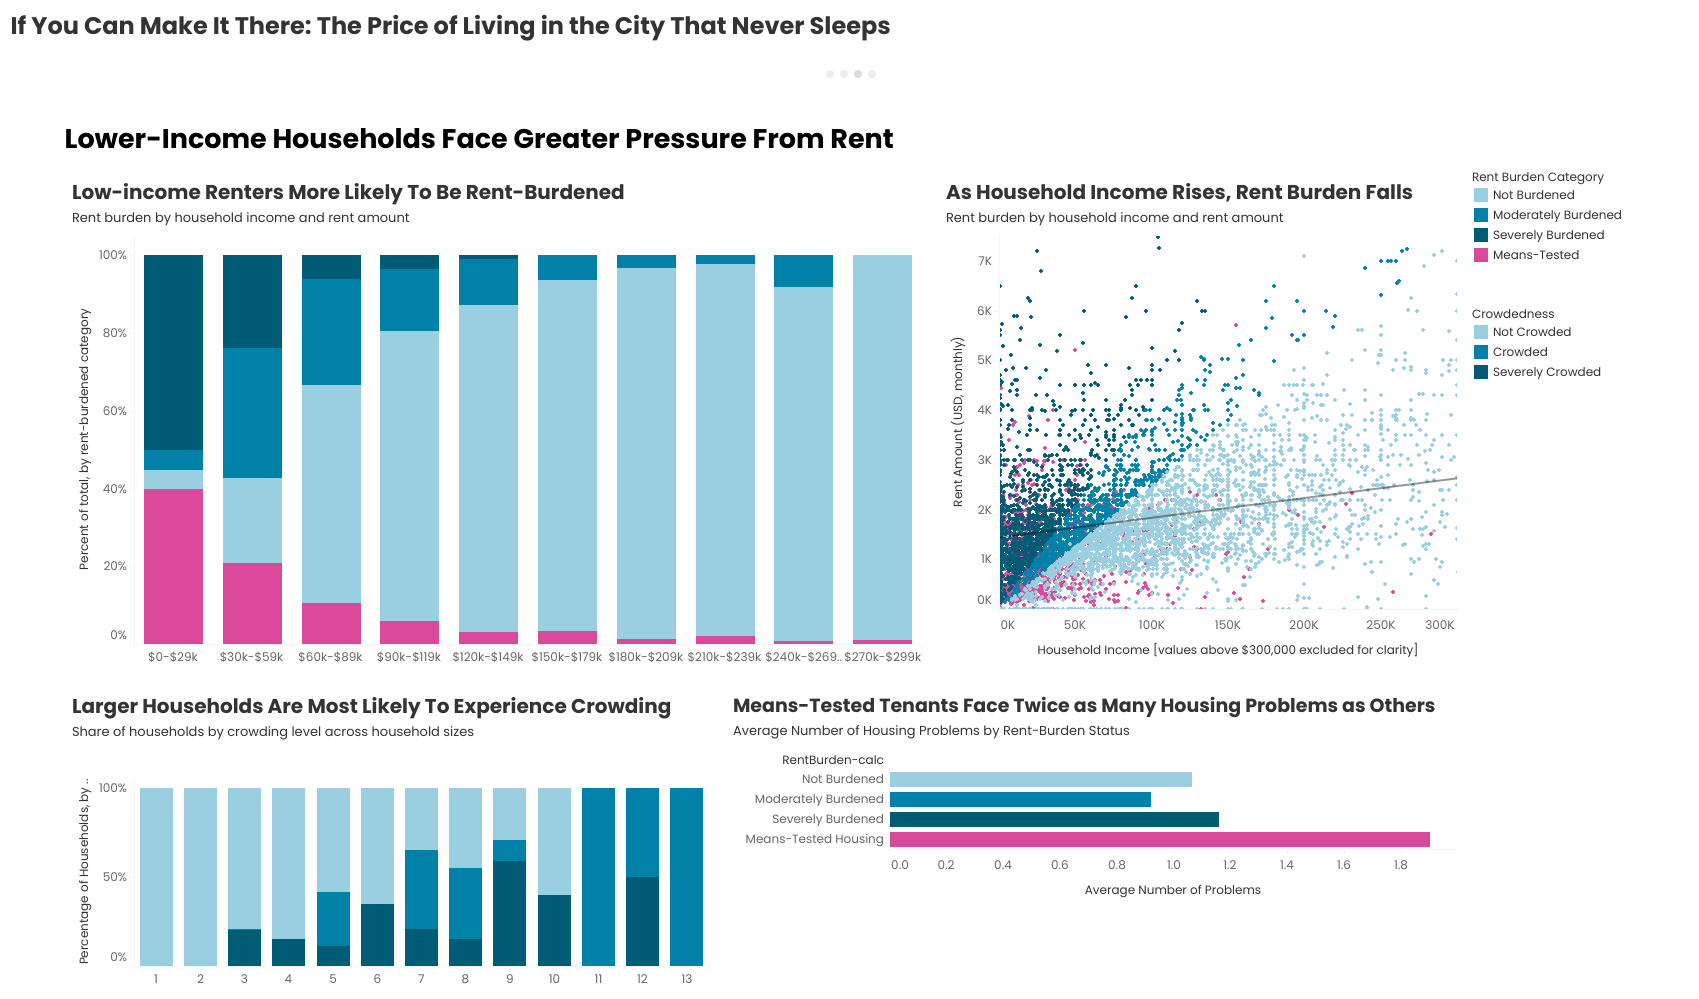
The third dashboard highlights the fact that lower-income renters are more likely to be rent-burdened.
Across the dashboard views, I have intentionally used a varied visualization vocabulary, demonstrating fluency in matching chart form to the specific argument each dataset needs to make. Throughout the project, I consistently asked myself, ‘is this chart telling the story I need it to tell?’ and when it didn’t, I went back to the drawing board. The result is a data story that takes the user through the difficulties, financial and otherwise, of being a renter in New York City.